
Dear client or friend of Vailshire Partners LP,
Happy Autumn! I hope this season’s quarterly client memo finds you well.
The State of the Economy
Similar to what I wrote in my last memo to you, the United States remains on the precipice of a recession. In fact, the manufacturing sector is already in a recession and the services sector is heading in that direction. The unemployment level–a final bastion of optimism–remains at or near historic lows… although this tends to be a lagging economic indicator.
In light of these increasingly obvious signs of impending economic bleakness, I expect continued market volatility as the stock market bulls and bears battle it out directionally. Guessing which way the markets will move in the near-term–which are as fickle as a presidential tweet–is a fool’s errand, in my opinion.
For his part, the Federal Reserve chairman, Jerome Powell, continues to reassure market participants that the Fed will pull-out all the stops to facilitate continued economic and market growth. In addition, it is possible that a truce may be announced regarding the US-China trade war. While either of these may provide a short-term pop in the market, neither are likely to reverse the decelerating business cycle.
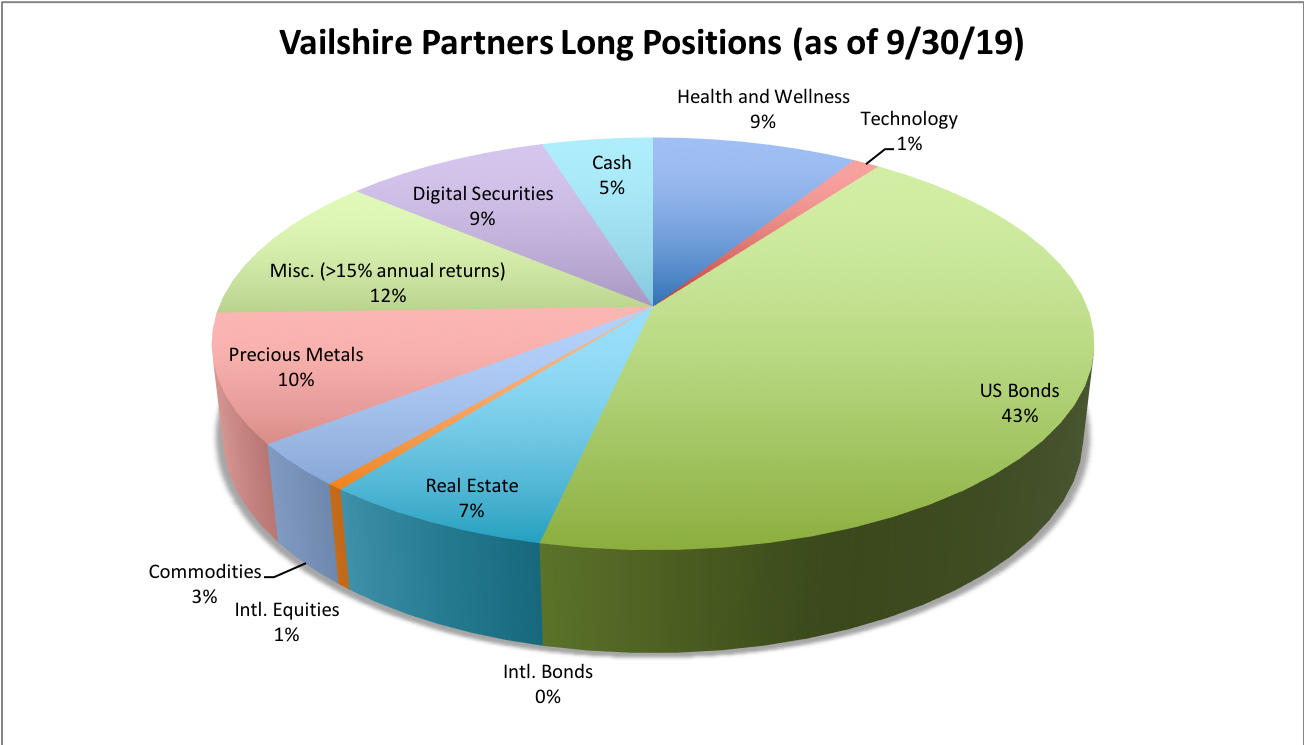
A recession is coming to the US…. It is officially “when,” not “if.” Here is a pie chart of the long holdings within Vailshire Partners, LP, as of September 30, 2019:
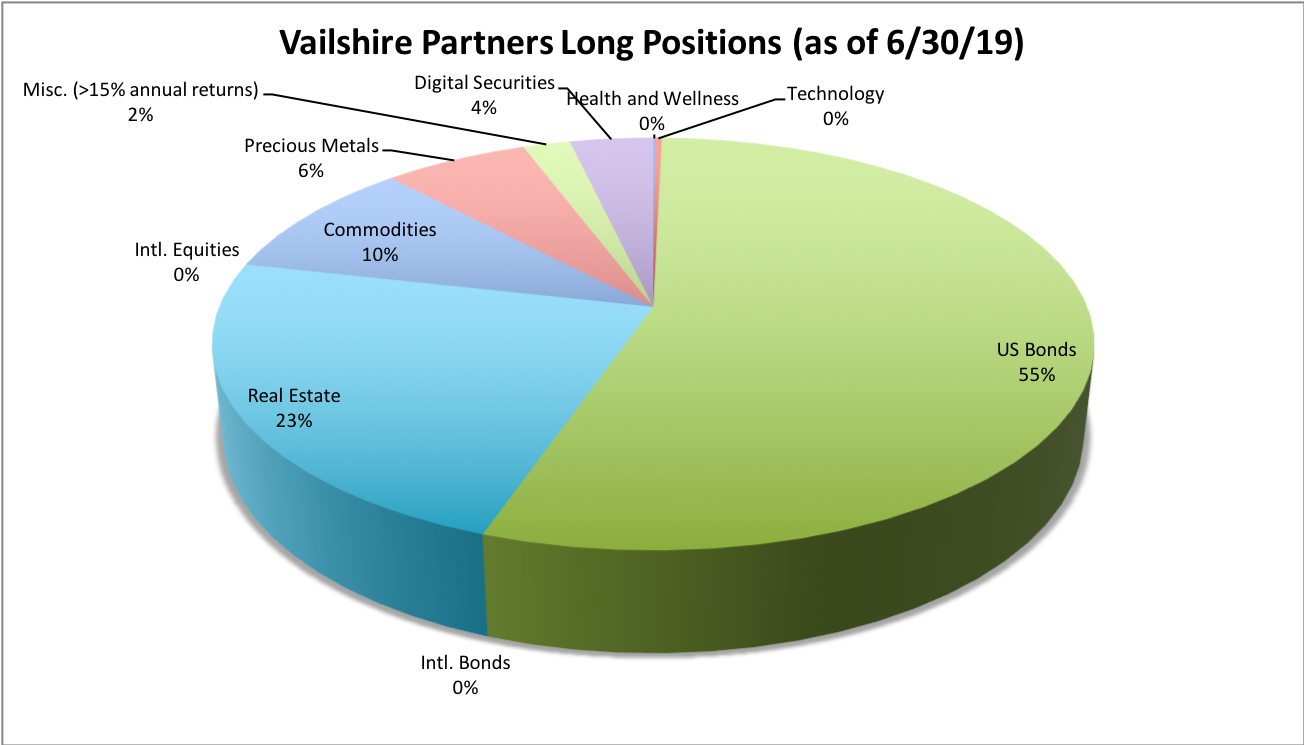
For comparison, here were our long holdings within Vailshire Partners, LP, as of June 30, 2019:
Despite our generally defensive positioning within the fund, some of our US high-yield bonds and other equities performed poorly during the month of September, resulting in a monthly decline of -6.08%. This resulted in a 3Q quarterly return of -5.05%, and a year-to-date return of +3.38%.
Looking Ahead: Strategy for 4Q 2019 and Beyond
To ensure that we are prepared for–and ready to profit from–the coming tumultuous times, Vailshire Partners, LP is already transitioning to a proprietary “all-seasons” portfolio, consisting of US and international equities, US and international bonds, gold, bitcoin, and cash.
Historically, these asset classes are relatively non-correlated–meaning that when one asset zigs, the other tends to zag… or zig… or remain flat… or do whatever it wants to do. These non-conformist assets serve to reduce the overall volatility of the portfolio. Our portfolio holdings will be rebalanced quarterly in the future, which results in the desirable circumstance of buying low and selling high… a key to exceptional long-term returns.
Regarding Bitcoin
For those who may be surprised by the addition (or increased prominence) of #bitcoin within our fund, please know that I have been studying it in depth and ad nauseum for the past several months… and have been personally investing in it for many years. I won’t go into too much detail here, but in its short history (of approximately a decade), bitcoin:
- has the highest risk-adjusted returns (“Sharpe ratio”) of any asset class
- is generally non-correlated with stocks or bonds
- has increased approximately 2,700,000% (not a typo!) since its first recorded value
- tends to increase 10x in value every four years
Most people still do not understand bitcoin’s significance or purpose, but given its scarcity, immutability, unhackability, and growing functionality (among other traits), it has shown to be an exceptional and unprecedented store of value.
Its infamous volatility notwithstanding, bitcoin’s exponential price increase to date has mathematically followed a highly predictable pattern based on its stock-to-flow ratio. I won’t bore you with the elegant details of this algorithm, but what follows is the historical data I dug up regarding the predicted price of bitcoin in the final week of September (since 2010) according to the #stock-to-flow ratio:
2010: $0.20 (predicted); $0.06 (actual)
2011: $1.56; $4.92
2012: $9.53; $10.52
2013: $73.15; $143.19
2014: $163.48; $421.86
2015: $388.15; $235.47
2016: $679.39; $600.25
2017: $5,552.02; $3,892.70
2018: $6,169.25; $6,686.13
2019: $8,290.55; $8,027.43
2020: $19,666.80; tbd
2021: $106,910.93; tbd
2022: $113,694.12; tbd
You should notice two things about these values:
- The stock-to-flow model is an excellent predictor of price.
- The price of bitcoin has dramatically increased since 2010 and is predicted to go much, much higher from current levels.
Hopefully this humble little presentation enables you to see why I think bitcoin deserves a place in every serious investor’s portfolio. In fact, I think it is becoming increasingly irresponsible of fund managers and investment advisors to not include bitcoin as a portfolio holding on behalf of their clients. I believe the addition of bitcoin in our fund will generate significant alpha (market-beating returns) over the ensuing years.
In conclusion
We continue to live in highly unusual and unprecedented times, politically and economically. While the future is as impossible as it ever has been to accurately predict, we would be foolish to not prepare for and try to profit from multiple scenarios.
I remain steadfastly vigilant and determined to Grow and Protect your hard-earned savings, regardless of what lies ahead. And given our portfolio of relatively non-correlated assets, I remain as optimistic as ever. I hope you do, as well.
If you have any questions or comments for me, please simply reply to this email or give me a call.
Investing wisely with you,
Jeff
P.S. Kudos to you if you have read this far! You may be interested to see what I have been up to recently:
- I was interviewed by the fine folks at IBM.TV — Here is the YouTube link.
- Tobin Arthur (the co-founder and CEO of AngelMD) and I recently interviewed famed economist, Raoul Pal, on our #Innovation4Alpha podcast.
- We also interviewed the famous deep value investor, Tobias Carlisle, here.
- And a while back, we interviewed another legendary value investor, Dan Ferris, here.